Available from FrameworX 10.1.6. |
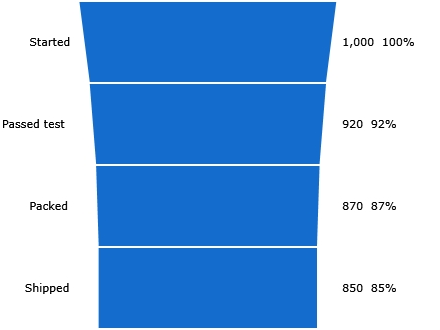
The FunnelChart draws a sequence of stages, each a trapezoid whose width is proportional to its value, labelled with the value and its percent of the first stage. Use it for production yield step by step (started, passed test, packed, shipped) or any process where quantities drop from stage to stage. Set Pyramid to draw the first stage at the bottom.
Requirements
This component is Portable. It runs both on Windows and on Web Pages hosted on any platform.
Clients: works in the Rich Client and in the web client (HTML5), with the same values and layout on both. Verified on FrameworX 10.1.6.
Configuration
- Go to Displays / Draw.
- In the Components Panel, select Charts, then choose FunnelChart.
- Click or drag-and-drop the component into the drawing area.
- Double-click the object to open the configuration window.
Data Binding
Tag mode (default): fill the Stages list, in order. Each stage has a Label, a LinkedValue (a number, a tag or an expression) and an optional FillBrush.
Table mode: set UseDataTable to true and point DataSourceLink to a Dataset query or table (
@Dataset.Query.Name/@Dataset.Table.Name) or a tag that holds a DataTable (@Tag.Name). CategoryColumn and ValueColumn name the columns.
Behavior
Percents are relative to the first stage. When the first stage is 0, missing, or negligible against the others, the percents show a dash and the widths scale to the largest stage.
A negative value is drawn as 0. A stage larger than the first shows more than 100 % at the width of the first stage.
At most 20 stages are drawn; the remaining ones are summarized as "+N more".
Properties
Property | Description | Default |
|---|---|---|
Stages | Tag mode: the stages, in order (Label, LinkedValue, FillBrush). | (empty) |
UseDataTable | Read the stages from a table instead of the Stages list. | false |
DataSourceLink | Table mode: the data source (Dataset query or table, or a DataTable tag). | (empty) |
CategoryColumn | Table mode: column that holds the stage label. | Category |
ValueColumn | Table mode: column that holds the stage value. | Value |
Pyramid | Draw the first stage at the bottom. | false |
StageGap | Space between stages, in pixels. | 2 |
ShowValues | Show the value of each stage. | true |
ShowPercent | Show the percent of the first stage. | true |
ValueFormat | Format of the values. | #,0.## |
PercentFormat | Format of the percents. | 0.# |
LabelFontSize | Font size of the labels. | 11 |
LabelFontFamily | Font family of the labels. | Verdana |
Localize | Enable runtime text localization. | false |
Colors follow the Display theme by default: each color property has a theme slot. Set an explicit color (#AARRGGBB) only to override the theme. Color properties: StageFill (theme accent; a stage FillBrush overrides it) and LabelForeground.
Example
Production yield of one batch, in tag mode with four stages:
Label | Value | Shown as |
|---|---|---|
Started | 1000 | 1,000 100% |
Passed test | 920 | 920 92% |
Packed | 870 | 870 87% |
Shipped | 850 | 850 85% |
Each trapezoid narrows in proportion to its value, so the 15 % loss from start to shipment is visible at a glance.
Runtime Execution
At runtime the FunnelChart resizes the stages and updates the values and percents as the bound values change. The image shows the example above in the Rich Client; the web client draws the same chart.