Available from FrameworX 10.1.6. |
The ControlChart is a Shewhart SPC control chart with two stacked panes: the values (individuals or subgroup means) with their center line and control limits, and below them the dispersion (moving range or subgroup range). Points that break the Western Electric rules are highlighted in the alarm color.
Requirements
This component is Portable. It runs both on Windows and on Web Pages hosted on any platform.
Clients: works in the Rich Client and in the web client (HTML5), with the same values and layout on both. Verified on FrameworX 10.1.6.
Configuration
- Go to Displays / Draw.
- In the Components Panel, select Charts, then choose ControlChart.
- Click or drag-and-drop the component into the drawing area.
- Double-click the object to open the configuration window.
Data Binding
Live mode (default): bind LinkedValue to a tag; each value change is a sample.
Table mode: set UseDataTable to true and point DataSourceLink to a Dataset query or table (
@Dataset.Query.Name/@Dataset.Table.Name) or a tag that holds a DataTable (@Tag.Name). ValueColumn names the column of samples.Samples are grouped in time order. SubgroupSize 1 gives an I-MR chart (individuals and moving range); 2 to 10 gives an X-bar/R chart (subgroup means and ranges). An incomplete last subgroup is not plotted.
Behavior
SampleCount points (or subgroups) are shown.
The center line (CL) and the control limits (UCL, LCL) are computed from the points shown; for I-MR, UCL and LCL = CL ± 2.66 × average moving range. To use fixed limits, set UseFixedLimits and CenterLine, UpperLimit and LowerLimit (LowerLimit < CenterLine < UpperLimit).
Computed limits need at least 2 subgroups.
Western Electric rules, each on by default: Rule1BeyondLimits (a point beyond a control limit), Rule2TwoOfThree (2 of 3 points beyond 2 sigma on the same side), Rule3FourOfFive (4 of 5 points beyond 1 sigma on the same side) and Rule4EightSameSide (8 points in a row on the same side of the center line).
The chart only displays: it writes nothing to tags.
Properties
Property | Description | Default |
|---|---|---|
LinkedValue | Live mode: the measured value. | (empty) |
UseDataTable | Read the samples from a table instead of sampling LinkedValue. | false |
DataSourceLink | Table mode: the data source (Dataset query or table, or a DataTable tag). | (empty) |
ValueColumn | Table mode: column that holds the samples. | Value |
SubgroupSize | 1 for I-MR; 2 to 10 for X-bar/R. | 1 |
SampleCount | Number of points or subgroups shown. | 25 |
UseFixedLimits | Use CenterLine, UpperLimit and LowerLimit instead of computed limits. | false |
CenterLine | Fixed center line. | 0 |
UpperLimit | Fixed upper control limit. | 3 |
LowerLimit | Fixed lower control limit. | -3 |
Rule1BeyondLimits | Flag a point beyond a control limit. | true |
Rule2TwoOfThree | Flag 2 of 3 points beyond 2 sigma on the same side. | true |
Rule3FourOfFive | Flag 4 of 5 points beyond 1 sigma on the same side. | true |
Rule4EightSameSide | Flag 8 points in a row on the same side of the center line. | true |
ShowDispersionChart | Show the lower pane (moving range or range). | true |
ShowMarkers | Draw a marker on each point. | true |
ShowLimitLabels | Show the CL, UCL and LCL values next to the lines. | true |
ShowAxisLabels | Show the axis labels. | true |
Decimals | Number of decimals of the limit labels. | 3 |
DataStrokeThickness | Thickness of the data line. | 1.5 |
LabelFontSize | Font size of the labels. | 11 |
LabelFontFamily | Font family of the labels. | Verdana |
Colors follow the Display theme by default: each color property has a theme slot. Set an explicit color (#AARRGGBB) only to override the theme. Color properties: DataStroke (theme accent), CenterLineStroke, LimitStroke, AlarmFill (flagged points), GridStroke and LabelForeground.
Example
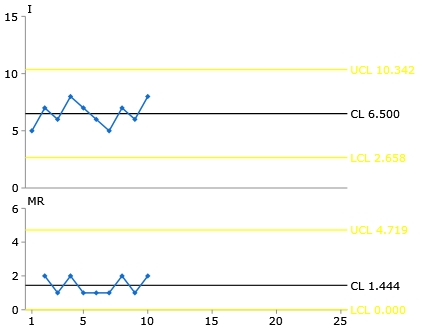
An I-MR chart (SubgroupSize 1, SampleCount 25) of ten individual measurements: 5, 7, 6, 8, 7, 6, 5, 7, 6, 8. The chart computes:
Pane | CL | UCL | LCL |
|---|---|---|---|
Individuals (I) | 6.500 | 10.342 | 2.658 |
Moving range (MR) | 1.444 | 4.719 | 0.000 |
The average moving range is 1.444, so UCL = 6.5 + 2.66 × 1.444 = 10.342. All points are inside the limits and no rule is broken, so no point is flagged. The x axis has room for the 25 points of SampleCount.
Runtime Execution
At runtime the ControlChart adds each new sample, recomputes the limits from the points shown and flags points that break the enabled rules. The image shows the example above in the Rich Client; the web client shows the same values.