Available from FrameworX 10.1.6. |
The HistogramChart is a process-capability histogram: it groups the samples of a measured characteristic into bins, draws the lower and upper specification limits (LSL, USL) and the target, overlays a normal curve and computes the capability indices Cp and Cpk (and optionally Pp and Ppk).
Requirements
This component is Portable. It runs both on Windows and on Web Pages hosted on any platform.
Clients: works in the Rich Client and in the web client (HTML5), with the same values and layout on both. Verified on FrameworX 10.1.6.
Configuration
- Go to Displays / Draw.
- In the Components Panel, select Charts, then choose HistogramChart.
- Click or drag-and-drop the component into the drawing area.
- Double-click the object to open the configuration window.
Data Binding
Live mode (default): bind LinkedValue to a tag. The chart keeps the newest SampleSize value changes.
Table mode: set UseDataTable to true and point DataSourceLink to a Dataset query or table (
@Dataset.Query.Name/@Dataset.Table.Name) or a tag that holds a DataTable (@Tag.Name). ValueColumn names the column of samples.LowerSpecLimitLink, UpperSpecLimitLink and TargetValueLink (a number or a tag) draw the LSL, USL and Target lines.
Behavior
Bins have equal width. BinCount 0 chooses the number of bins automatically (Sturges rule, 5 to 30). With UseFixedRange, the bins cover RangeMinimum to RangeMaximum and values outside are counted separately.
Cp and Cpk use the within-subgroup sigma (average moving range / 1.128): Cp = (USL − LSL) / 6σ and Cpk = min(USL − mean, mean − LSL) / 3σ. With only one limit set, Cpk uses that side.
With ShowPp, Pp and Ppk are computed in the same way with the overall sample standard deviation (n − 1).
ShowNormalCurve overlays the normal curve of the mean and the overall standard deviation.
Capability needs at least 2 samples and at least one specification limit; otherwise the chart shows a message instead of the indices.
Properties
Property | Description | Default |
|---|---|---|
LinkedValue | Live mode: the measured value. | (empty) |
UseDataTable | Read the samples from a table instead of sampling LinkedValue. | false |
DataSourceLink | Table mode: the data source (Dataset query or table, or a DataTable tag). | (empty) |
ValueColumn | Table mode: column that holds the samples. | Value |
SampleSize | Live mode: number of newest samples kept. | 100 |
BinCount | Number of bins; 0 for automatic. | 0 |
UseFixedRange | Use a fixed range (RangeMinimum to RangeMaximum) for the bins. | false |
RangeMinimum | Start of the fixed range. | 0 |
RangeMaximum | End of the fixed range. | 100 |
LowerSpecLimitLink | Lower specification limit (LSL), a number or a tag. | (empty) |
UpperSpecLimitLink | Upper specification limit (USL), a number or a tag. | (empty) |
TargetValueLink | Target value, a number or a tag. | (empty) |
ShowNormalCurve | Overlay the normal curve. | true |
ShowCapability | Show the statistics text (n, mean, Cp, Cpk). | true |
ShowPp | Also show Pp and Ppk. | false |
ShowAxisLabels | Show the axis labels. | true |
Decimals | Number of decimals of the mean and sigma in the statistics text. | 3 |
CurveStrokeThickness | Thickness of the normal curve. | 2 |
LabelFontSize | Font size of the labels. | 11 |
LabelFontFamily | Font family of the labels. | Verdana |
Colors follow the Display theme by default: each color property has a theme slot. Set an explicit color (#AARRGGBB) only to override the theme. Color properties: BarFill (theme accent), CurveStroke (theme amber), SpecLimitStroke, TargetStroke, GridStroke and LabelForeground.
Example
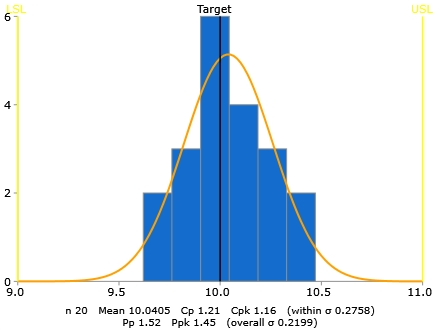
Twenty measurements of a part dimension in table mode, with LowerSpecLimitLink 9, UpperSpecLimitLink 11, TargetValueLink 10, ShowPp true and Decimals 4. The chart shows:
Statistic | Value |
|---|---|
n | 20 |
Mean | 10.0405 |
Cp / Cpk | 1.21 / 1.16 (within σ 0.2758) |
Pp / Ppk | 1.52 / 1.45 (overall σ 0.2199) |
Bins (automatic) | 6 bins with 2, 3, 6, 4, 3 and 2 samples |
The x axis runs from LSL (9.0) to USL (11.0), with the Target line at 10.0 and the normal curve over the bars.
Runtime Execution
At runtime the HistogramChart recomputes the bins and the indices as new samples arrive or the table changes. The image shows the example above in the Rich Client; the web client shows the same values.