


Home → How-to Guides → Solution Examples → Architecture Examples → Process Diagrams AI Designer Example
This page shows how FrameworX AI Designer builds a process display from a drawing you already have — a P&ID, a PFS, or a scanned sheet — instead of from a written description.
Two examples are included, from different industries and at very different sizes, with the prompt that produced them.
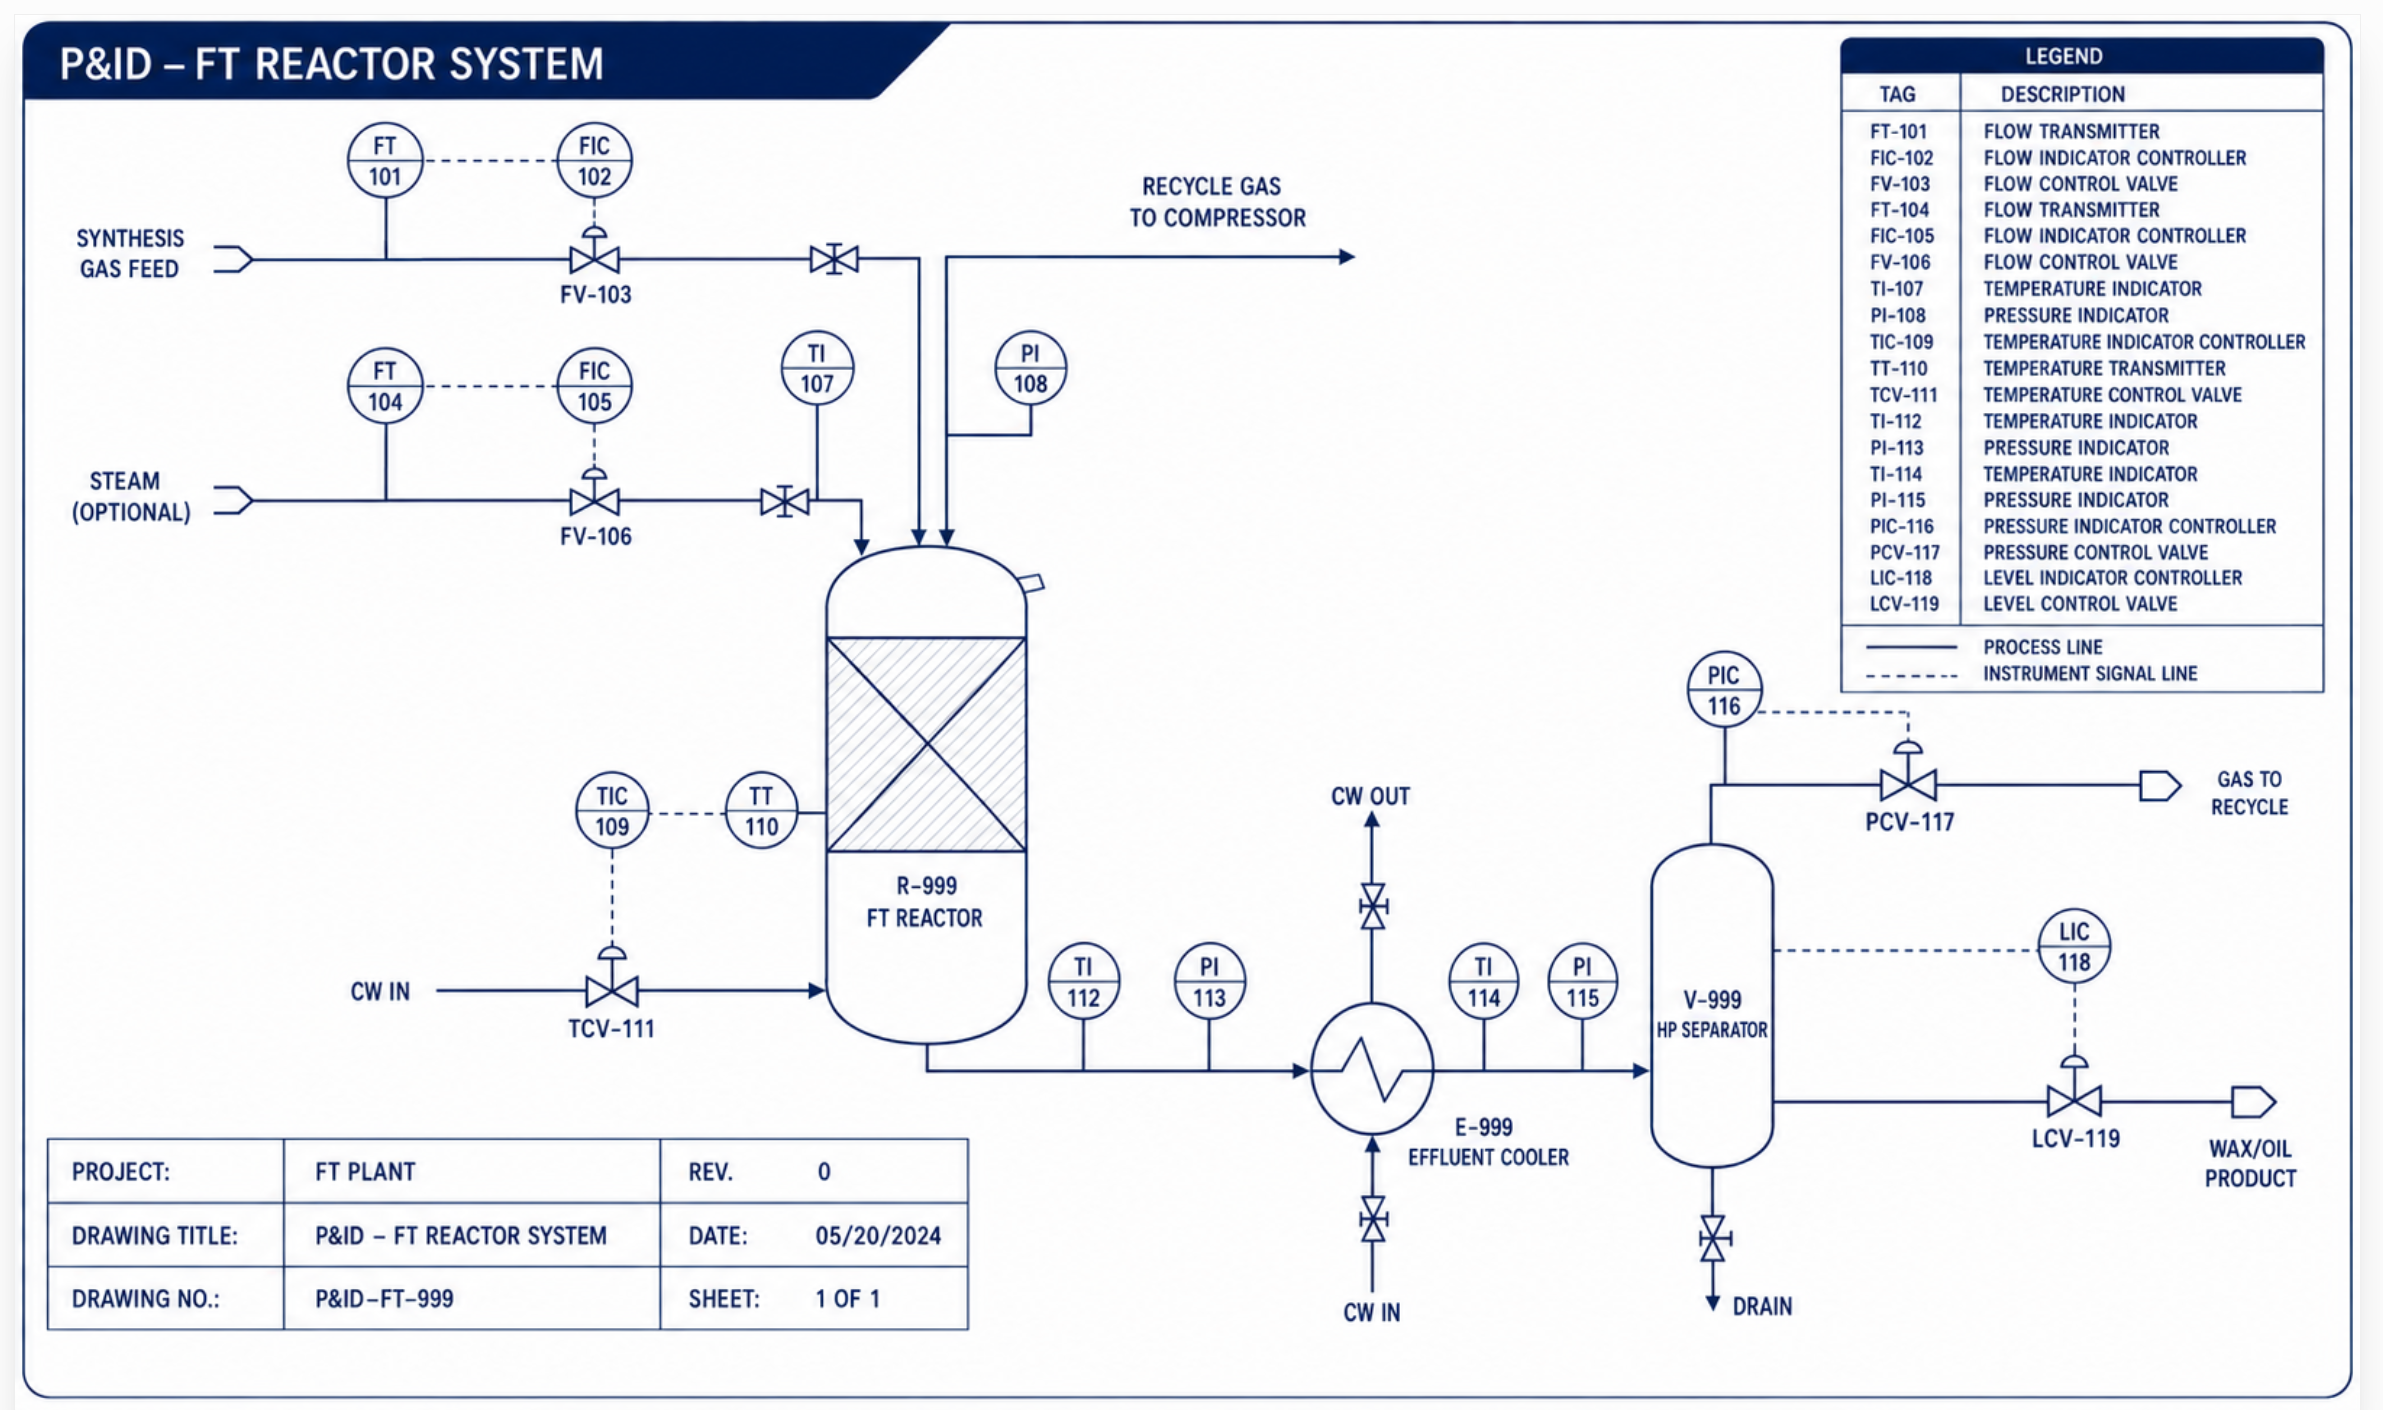
Solution downloads: FT_Reactor_System.dbsln · CPF_2100.dbsln
Diagrams: FTReactor-Diagram.png · CPF-2100S-Diagram.pdf
The downloadable solutions require FrameworX 10.1.5e or later.
What this page shows
Most projects do not start from a blank screen. They start from a drawing the plant already uses. AI Designer reads that drawing, measures it, and generates a FrameworX display that keeps the original layout — same equipment, same instrument tags, same stream numbers, in the same relative positions.
The value is not that a picture becomes a screen. It is that the operator still recognises the drawing they have used for years.
The prompt
This is the part worth copying. A vague request produces a display that looks plausible and is wrong in its details. The prompt below is explicit about position, and that is what makes the objects land in the same place as the original.
Build a FrameworX solution from the attached drawing, in this order:

1. Read the drawing. It is a scan with no text layer, so measure rather than eyeball: overlay a
   coordinate grid, read each object's position into a table, and list every instrument tag.
2. Create those tags, and a simulator channel driving them, so the display has live values to bind to.
3. Generate the display from the coordinate table, mapped with one scale factor. Reproduce the layout
   exactly: same equipment, instruments and stream numbers in the same relative positions. Do not
   rearrange or simplify it.
4. Then give it life without moving anything: colour the pipe runs by service, fill each vessel to its
   live level, show pumps and compressors as running. Animate state, never position. Keep it restrained.
5. Run it and show me a runtime screenshot.
Four phrases carry the result. Leave any of them out and the failure is predictable:
Phrase | What it prevents |
|---|---|
measure rather than eyeball | Elements placed where they look right. The result is well composed, plausible, and wrong — and because it looks fine, no review catches it. |
overlay a coordinate grid, read each object's position into a table | Positions being guessed per object. The table becomes the source of truth, and it is reviewable. |
one scale factor | Per-object fudging. One factor applied to every coordinate is what preserves every relative position and proportion. |
animate state, never position | Equipment drifting or sliding once dynamics are added. A P&ID that animates position stops being a P&ID. |
How it works
- Measure. The drawing is read against an overlaid coordinate grid and every object is recorded in a table — equipment bounds, instrument bubbles, valves, stream labels, pipe runs — in the drawing's own pixel space.
- Check the table by drawing it back. The table is rendered out again and compared against the source. Reading positions off a drawing and drawing them back are different operations, and only the round trip catches what a single pass misses.
- Generate, never hand-place. The display is generated from the table with one scale factor, so changing the target size later is a one-line change and the whole drawing follows.
- Animate state. Pipe runs coloured by service, vessels filled to live level, valves tinted by open state, pumps and compressors showing run state, live values beside each instrument.
The coordinate table stays with the project. It is the asset: it drives the display, survives a re-scale, and is what a second engineer reviews.
Example 1 — FT Reactor System
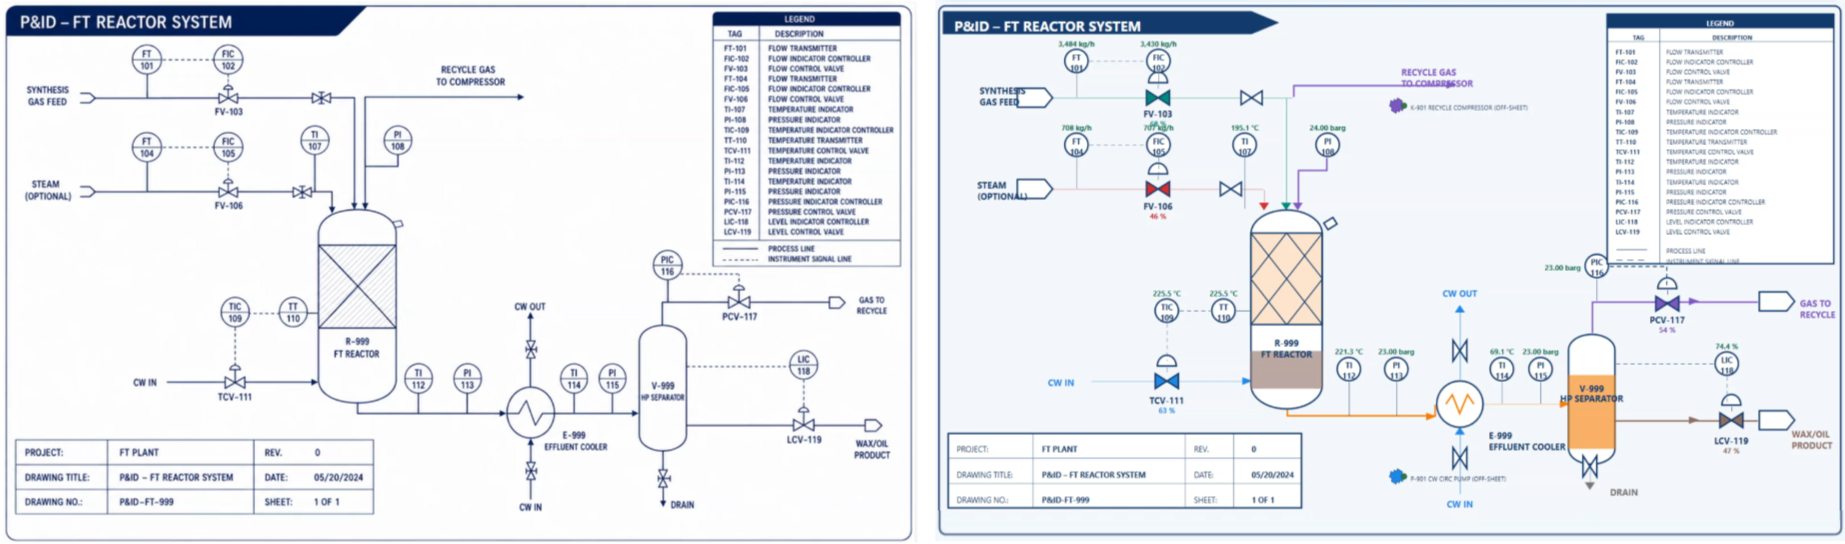
Drawing P&ID-FT-999 Rev 0, a Fischer-Tropsch reactor loop. A raster scan, again with no text layer.
Reproduced: the reactor with its catalyst bed, the effluent cooler, the HP separator, all 19 instrument tags, the feed and steam headers with their control valves, and the sheet's own legend and title block.
Smaller than the second example, and included for the opposite reason: it shows the method holding at tag-for-tag detail on a single unit, legend and title block included.
Example 2 — Central Production Facility
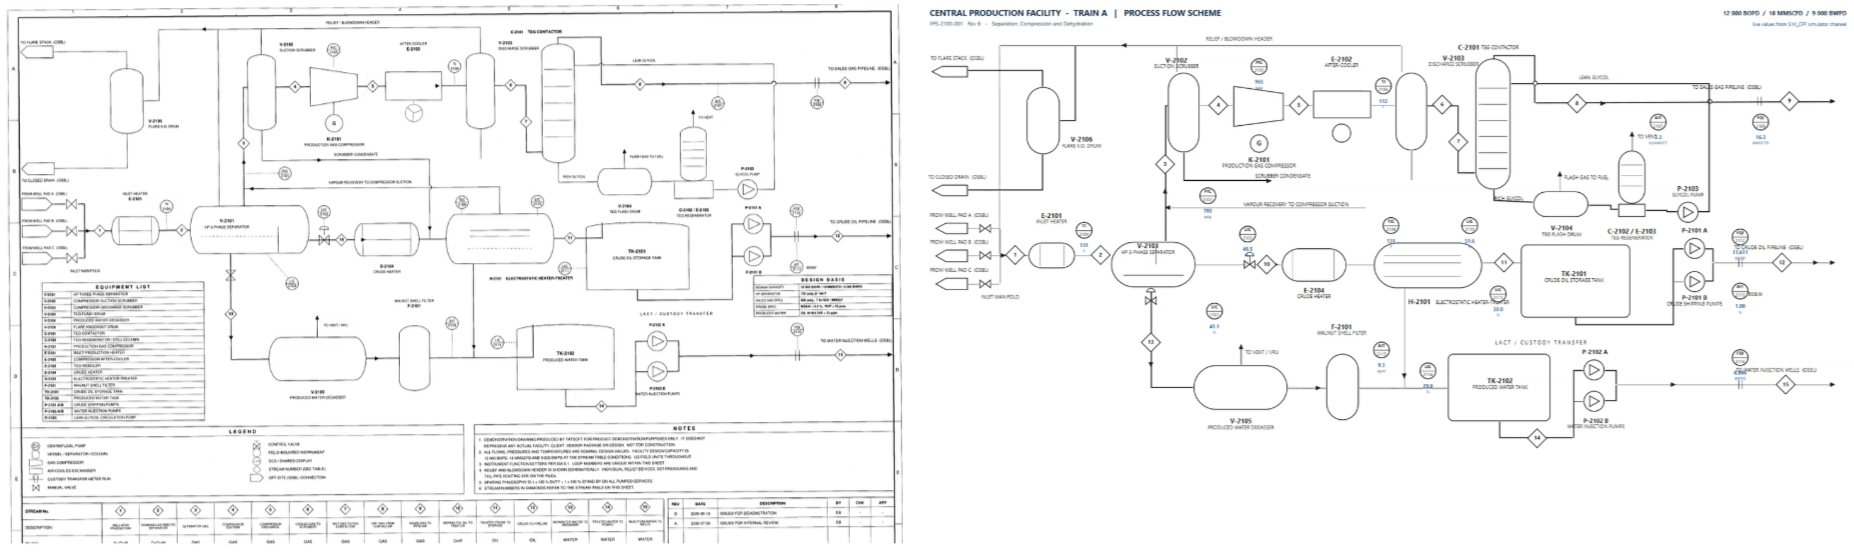
Drawing PFS-2100-001 Rev B, an A1 landscape sheet scanned at roughly 150 dpi: 4967 × 3508 pixels, no text layer, no vectors. Separation, compression, dehydration and water injection on one sheet.
Reproduced: 23 equipment shapes, 16 instrument loops (2101–2116), 15 stream numbers, and the OSBL connections. Scale factor 0.385 onto a 1920 × 1080 canvas.
This is the useful stress test. At this size a merely plausible layout falls apart immediately, because 23 pieces of equipment and 15 stream numbers all have to stay in the right relationship to each other across the full width of the sheet.
Bring your own drawing
- Legibility beats resolution. Tag bubbles and line labels must be readable in the source. A clean 1500 px-wide export beats a large blurry scan.
- Decide replica or derived first. If the drawing is the specification, its geometry is the requirement. If it is only authoritative for the process, the layout can be re-composed. Say which.
- Decide what counts as the drawing. A full engineering sheet carries an equipment list, legend, notes and a stream table beside the process layout. Reproducing the process region and leaving the rest is usually right, but record it as a decision.
- Name any departures. Anything the drawing does not contain — equipment referenced but not drawn, a level with no instrument — is listed explicitly rather than quietly invented.
Related
Skill Display Construction - Canvas — the measured-replica method in full.
AI Designer In Action — how the Designer MCP connection works.
AI Designer Best Practices — getting good results from a session.