


Updated in FrameworX 10.1.6: rebuilt on FrameworX's own code; now also available in the web (HTML5) client.
The SankeyChart is a graphical component used to visualize the flow and distribution of resources, energy, or data between entities within a system. It displays proportional flows and supports analysis of multi-dimensional data through visual representation.
Each flow goes from one named node to another and is drawn as a ribbon whose width is proportional to the flow's weight.
Requirements
From FrameworX 10.1.6 this component is Portable. It runs both on Windows and on Web Pages hosted on any platform. In earlier versions it is available only for Windows WPF applications.
Clients: works in the Rich Client and in the web client (HTML5), with the same values and layout on both. Verified on FrameworX 10.1.6.
Displays created in earlier versions keep their Sankey settings and open as before.
Configuration
- Go to Displays / Draw.
- In the Components Panel, select Charts, then choose SankeyChart.
- Click or drag-and-drop the component into the drawing area.
- Double-click the object to open the configuration window.

SankeyChart Settings | |
|---|---|
Field | Description |
Flow Direction | Sets the direction of flow in the diagram.
|
Highlight Mode | Defines interaction for highlighting nodes and links.
|
First And Last Label Position | Sets the position of the first and last labels.
|
Show Labels | Enables or disables display of node and link labels. |
Link Curvature | Sets the curvature of links. Range: 0 to 1. Higher values result in more curved links. |
Node Thickness | Sets the thickness of nodes. Value may change with panel size. |
Node Gap | Defines spacing between nodes. Value may change with panel size. |
Highlight Opacity | Controls opacity of highlighted elements when no HighlightBrush is set. Range: 0 to 1. |
Node Name | Sets the identifier or label of a node. |
Node Color | Sets the color of a node. |
Link From | Defines the source node of a link. |
Link To | Defines the target node of a link. |
Link Weight | Sets the weight of a link, which determines its thickness. Can be a fixed value or an object. |
Data Binding
The flows are stored in XmlStringSankeyData as an XML string: an
ArrayOfSankeyDataroot with oneSankeyDataelement per flow. Each flow hasFromandTo(node names) and an optionalWeight.Weight can be a number, a tag or an expression. When it is not set the weight is 1, and a weight of 0 or less is drawn as 1. When a tag used as a weight changes, the chart redraws in place.
Per-node colors are stored in XmlStringNodeBrushes (an
ArrayOfSankeyNodeSettingsroot withSankeyNodeSettingselements holding Name and Color). The configuration window fills both strings. From FrameworX 10.1.6, a node with no Color draws in the chart's standard colors, and Color accepts a color name,#RRGGBBor#AARRGGBB.Define the nodes. Add a node (Name) for every From and To name used by the flows. A chart whose data defines flows but no node list draws nothing.
<ArrayOfSankeyData>
  <SankeyData><From>Feed</From><To>Kiln</To><Weight>40</Weight></SankeyData>
  <SankeyData><From>Feed</From><To>Mill</To><Weight>Tag.MillFeed</Weight></SankeyData>
  <SankeyData><From>Kiln</From><To>Silo</To><Weight>40</Weight></SankeyData>
</ArrayOfSankeyData>
Behavior
Nodes in a column keep their order when the chart is drawn or redrawn.
With SankeyHighlightMode = MouseEnter (default), resting the pointer on a node or a link highlights it with its connected ribbons; moving the pointer away returns the chart to normal.
With MouseLeftButtonUp, a click on a node or a link highlights it; a second click, or a click on an empty area, clears the highlight.
While an element is highlighted, the other elements are drawn with the LoweredOpacity.
In the Designer, every Sankey chart previews a built-in sample flow. At runtime each chart draws its own data.
Properties
Property | Description | Default |
|---|---|---|
XmlStringSankeyData | The flows (From, To, Weight), as an XML string. | (empty) |
XmlStringNodeBrushes | The per-node colors (Name, Color), as an XML string. | (empty) |
SankeyFlowDirection | LeftToRight or TopToBottom. | LeftToRight |
SankeyShowLabels | Show the node labels. | true |
FirstAndLastLabelPosition | Inward or Outward. | Inward |
NodeThickness | Thickness of the nodes. | 25 |
NodeGap | Space between the nodes of a column. | 5 |
SankeyLinkCurvature | Curvature of the links, 0 to 1. | 0.95 |
SankeyHighlightMode | MouseLeftButtonUp or MouseEnter. | MouseEnter |
HighlightBrush | Color of the highlighted elements. When not set, HighlightOpacity is used. | (empty) |
HighlightOpacity | Opacity of the highlighted elements when no HighlightBrush is set, 0 to 1. | 0.95 |
LoweredOpacity | Opacity of the other elements while one is highlighted, 0 to 1. | 0.45 |
UsePalette | Which elements take their colors from the automatic palette: NodesLinks, LinksOnly or None. | NodesLinks |
Example
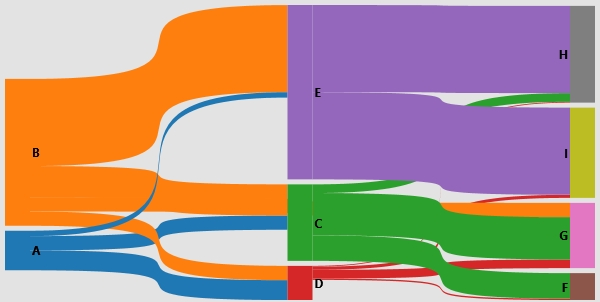
Nine nodes, A to I, with sixteen flows and one color per node:
From | To (Weight) |
|---|---|
A | C (255), D (355), E (95) |
B | C (555), D (255), E (1555), G (255) |
C | F (455), G (755), H (155) |
D | F (25), G (155), H (15), I (55) |
E | H (1555), I (1555) |
The chart places the source nodes A and B on the left and the end nodes F to I on the right. Each ribbon is as wide as its weight, so the large flows through E stand out.
Runtime Execution
At runtime, the SankeyChart control generates a Sankey diagram based on the configured parameters. When the runtime environment starts, the control renders the diagram according to the defined settings. The diagram supports interaction and dynamically responds to configuration changes, enabling analysis of data flows and relationships within the application.
The image shows the example above in the Rich Client; the web client draws the same chart.
In this section...