


Available from FrameworX 10.1.6.
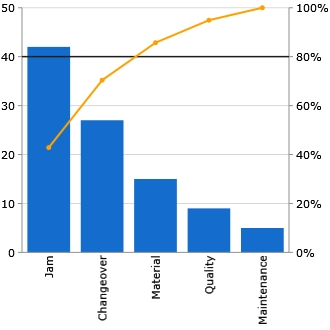
The ParetoChart shows the 80/20 view of downtime reasons, defect causes or top alarms. Columns are sorted by value, largest first, and a cumulative-percent line on a right 0-100 % axis shows how much of the total the first categories account for. A reference line marks the 80 % point.
Requirements
This component is Portable. It runs both on Windows and on Web Pages hosted on any platform.
Clients: works in the Rich Client and in the web client (HTML5), with the same values and layout on both. Verified on FrameworX 10.1.6.
Configuration
- Go to Displays / Draw.
- In the Components Panel, select Charts, then choose ParetoChart.
- Click or drag-and-drop the component into the drawing area.
- Double-click the object to open the configuration window.
Data Binding
Tag mode (default): fill the DataItems list. Each item has a Label and a LinkedValue (a number, a tag or an expression).
Table mode: set UseDataTable to true and point DataSourceLink to a Dataset query or table (
@Dataset.Query.Name/@Dataset.Table.Name) or a tag that holds a DataTable (@Tag.Name). CategoryColumn and ValueColumn name the columns.
Behavior
Categories with the same name are summed. Negative or missing values count as 0. Ties keep the input order.
With TopCount greater than 0, the categories beyond the top N are summed into one OtherLabel column, which is always drawn last. With more than 100 categories, the chart draws the top 99 plus Other.
When the total is 0, the cumulative line is not drawn.
At runtime, a click on a column writes the category name to the tag in SelectedItemLink. The tag is written only when its value changes.
Properties
Property | Description | Default |
|---|---|---|
DataItems | Tag mode: the list of items (Label, LinkedValue). | (empty) |
UseDataTable | Read the categories from a table instead of the DataItems list. | false |
DataSourceLink | Table mode: the data source (Dataset query or table, or a DataTable tag). | (empty) |
CategoryColumn | Table mode: column that holds the category name. | Category |
ValueColumn | Table mode: column that holds the value. | Value |
TopCount | Number of categories drawn before the Other column, 0 (all) to 99. | 0 |
OtherLabel | Name of the column that sums the categories beyond TopCount. | Other |
ReferencePercent | Position of the reference line on the right axis, 0 to 100. | 80 |
ShowReferenceLine | Draw the reference line. | true |
ShowMarkers | Draw markers on the cumulative line. | true |
CumulativeStrokeThickness | Thickness of the cumulative line, 0 to 10; also sizes its markers. | 2 |
ShowAxisLabels | Show the axis labels. | true |
ShowCategoryLabels | Show the category names under the columns. | true |
ShowGridLines | Show the grid lines. | true |
LabelFontSize | Font size of the labels. | 11 |
LabelFontFamily | Font family of the labels. | Verdana |
SelectedItemLink | Optional tag that receives the clicked category name. | (empty) |
Localize | Enable runtime text localization. | false |
Colors follow the Display theme by default: each color property has a theme slot. Set an explicit color (#AARRGGBB) only to override the theme. Color properties: ColumnFill (theme accent), CumulativeStroke (theme amber), ReferenceStroke, AxisStroke and LabelForeground.
Example
Downtime minutes by reason, in tag mode with five items:
Label | Value | Cumulative % |
|---|---|---|
Jam | 42 | 42.9 |
Changeover | 27 | 70.4 |
Material | 15 | 85.7 |
Quality | 9 | 94.9 |
Maintenance | 5 | 100 |
The chart sorts the columns from the largest to the smallest whatever the input order. The cumulative line crosses the 80 % reference line between Changeover and Material: those three reasons cause most of the downtime.
Runtime Execution
At runtime the ParetoChart re-sorts and redraws when the values change. The image shows the example above in the Rich Client; the web client draws the same chart.
In this section...