


Available from FrameworX 10.1.6.
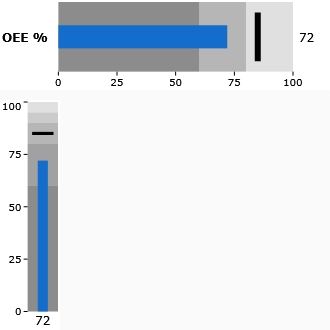
The BulletChart (bullet graph) shows one KPI as a bar against a target marker, over 2 to 5 shaded bands that mark poor, satisfactory and good ranges. It is a compact replacement for a gauge on dashboards and KPI tiles, horizontal or vertical.
Requirements
This component is Portable. It runs both on Windows and on Web Pages hosted on any platform.
Clients: works in the Rich Client and in the web client (HTML5), with the same values and layout on both. Verified on FrameworX 10.1.6.
Configuration
- Go to Displays / Draw.
- In the Components Panel, select Charts, then choose BulletChart.
- Click or drag-and-drop the component into the drawing area.
- Double-click the object to open the configuration window.
Data Binding
LinkedValue: the KPI value (a number, a tag or an expression).
TargetLink: optional target, drawn as a marker (a number or a tag).
The scale is static, from MinValue to MaxValue.
Behavior
BandCount (2 to 5) sets the number of bands; Band1Limit to Band4Limit set their limits.
The worst band is the darkest. With HighIsGood set to false, the high end of the scale is the worst.
With ShadeBands set to false, each band given its own color (Band1Fill to Band5Fill) is drawn at full strength; bands left on the default color keep the shading.
A value or target outside the scale stops at the end of the scale, while the value text shows the real number. A missing value draws no bar and shows a dash.
Properties
Property | Description | Default |
|---|---|---|
LinkedValue | The KPI value. | (empty) |
TargetLink | Optional target value, drawn as a marker. | (empty) |
MinValue | Start of the scale. | 0 |
MaxValue | End of the scale. | 100 |
BandCount | Number of bands, 2 to 5. | 3 |
Band1Limit | Upper limit of band 1. | 60 |
Band2Limit | Upper limit of band 2. | 80 |
Band3Limit | Upper limit of band 3 (BandCount 4 or 5). | 90 |
Band4Limit | Upper limit of band 4 (BandCount 5). | 95 |
ShadeBands | Shade the bands from dark (worst) to light (best). | true |
HighIsGood | High values are good. Set to false when low values are good. | true |
Vertical | Draw the chart vertically, with the bar growing from the bottom. | false |
Label | Optional caption. | (empty) |
ShowValueText | Show the value as text. | true |
ValueFormat | Format of the value text. | 0.## |
ShowScale | Show the scale. | true |
ScaleDivisions | Number of scale divisions. | 4 |
ScaleFormat | Format of the scale labels. | 0.## |
LabelFontSize | Font size of the caption and texts. | 12 |
LabelFontFamily | Font family of the caption and texts. | Verdana |
Localize | Enable runtime text localization. | false |
Colors follow the Display theme by default: each color property has a theme slot. Set an explicit color (#AARRGGBB) only to override the theme. Color properties: ValueBarFill (theme accent), TargetStroke, LabelForeground and Band1Fill to Band5Fill.
Example
An OEE KPI on a dashboard: Label OEE %, LinkedValue 72 (in a real solution, a tag such as @Tag.Line1/OEE), TargetLink 85, scale 0 to 100, and the default three bands with limits 60 and 80.
The bar ends at 72, in the middle band; the target marker stands at 85, in the best band; the value text reads 72. The second chart in the image is the same KPI with Vertical set to true and BandCount 5.
Runtime Execution
At runtime the bar and the target marker move as the bound values change. The image shows a horizontal and a vertical BulletChart in the Rich Client; the web client draws the same charts.
In this section...