Page Tree
Software Knowledgebases
| In this section... | ||||
|---|---|---|---|---|
|
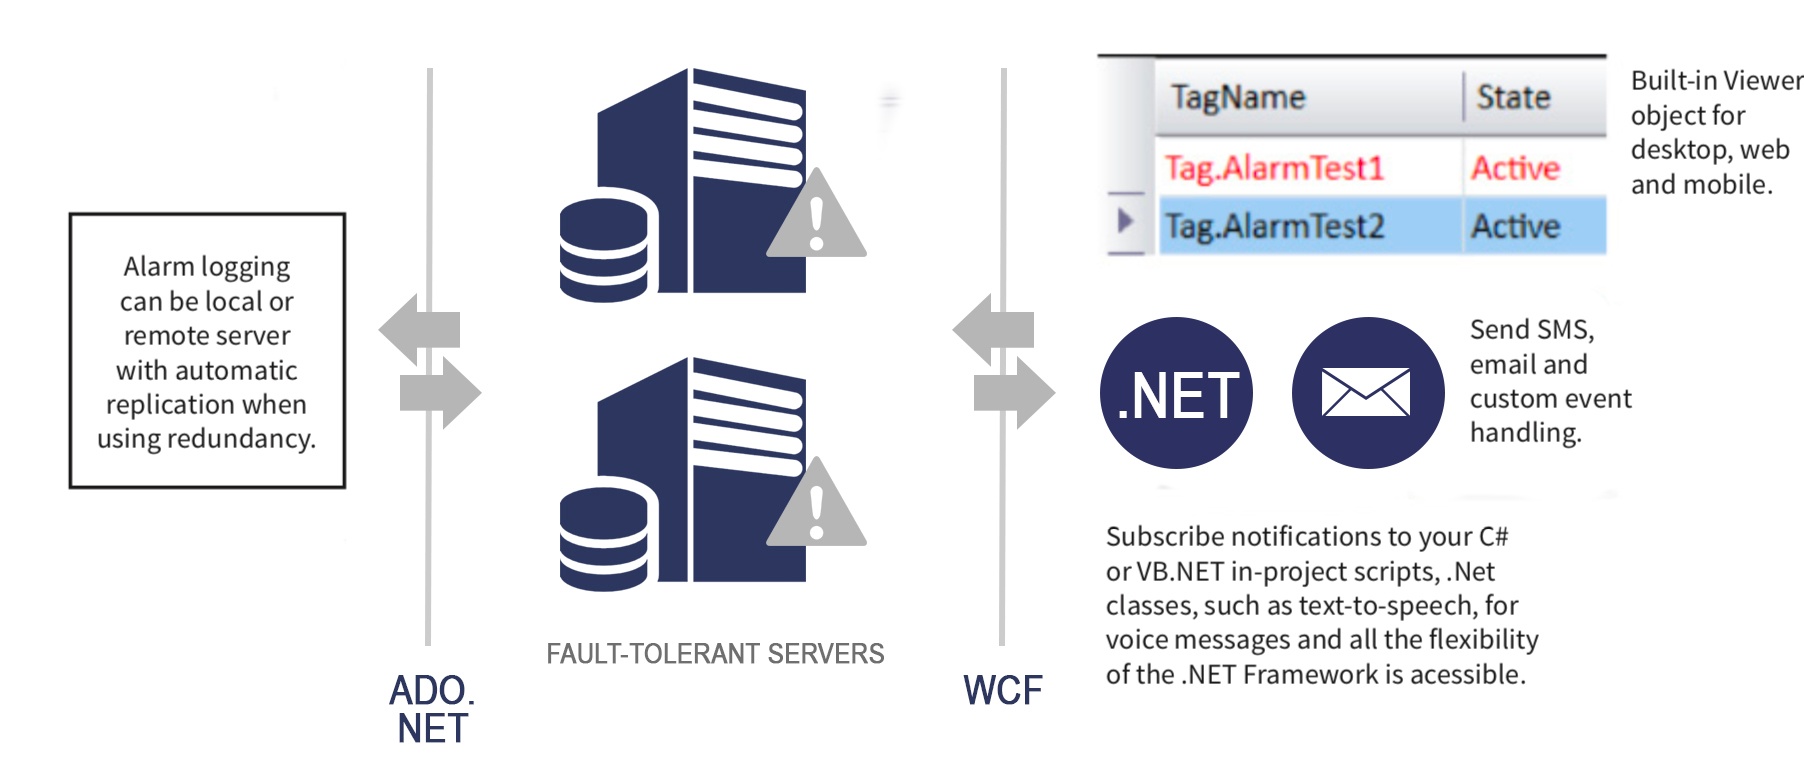
Real-time Alarm Processing
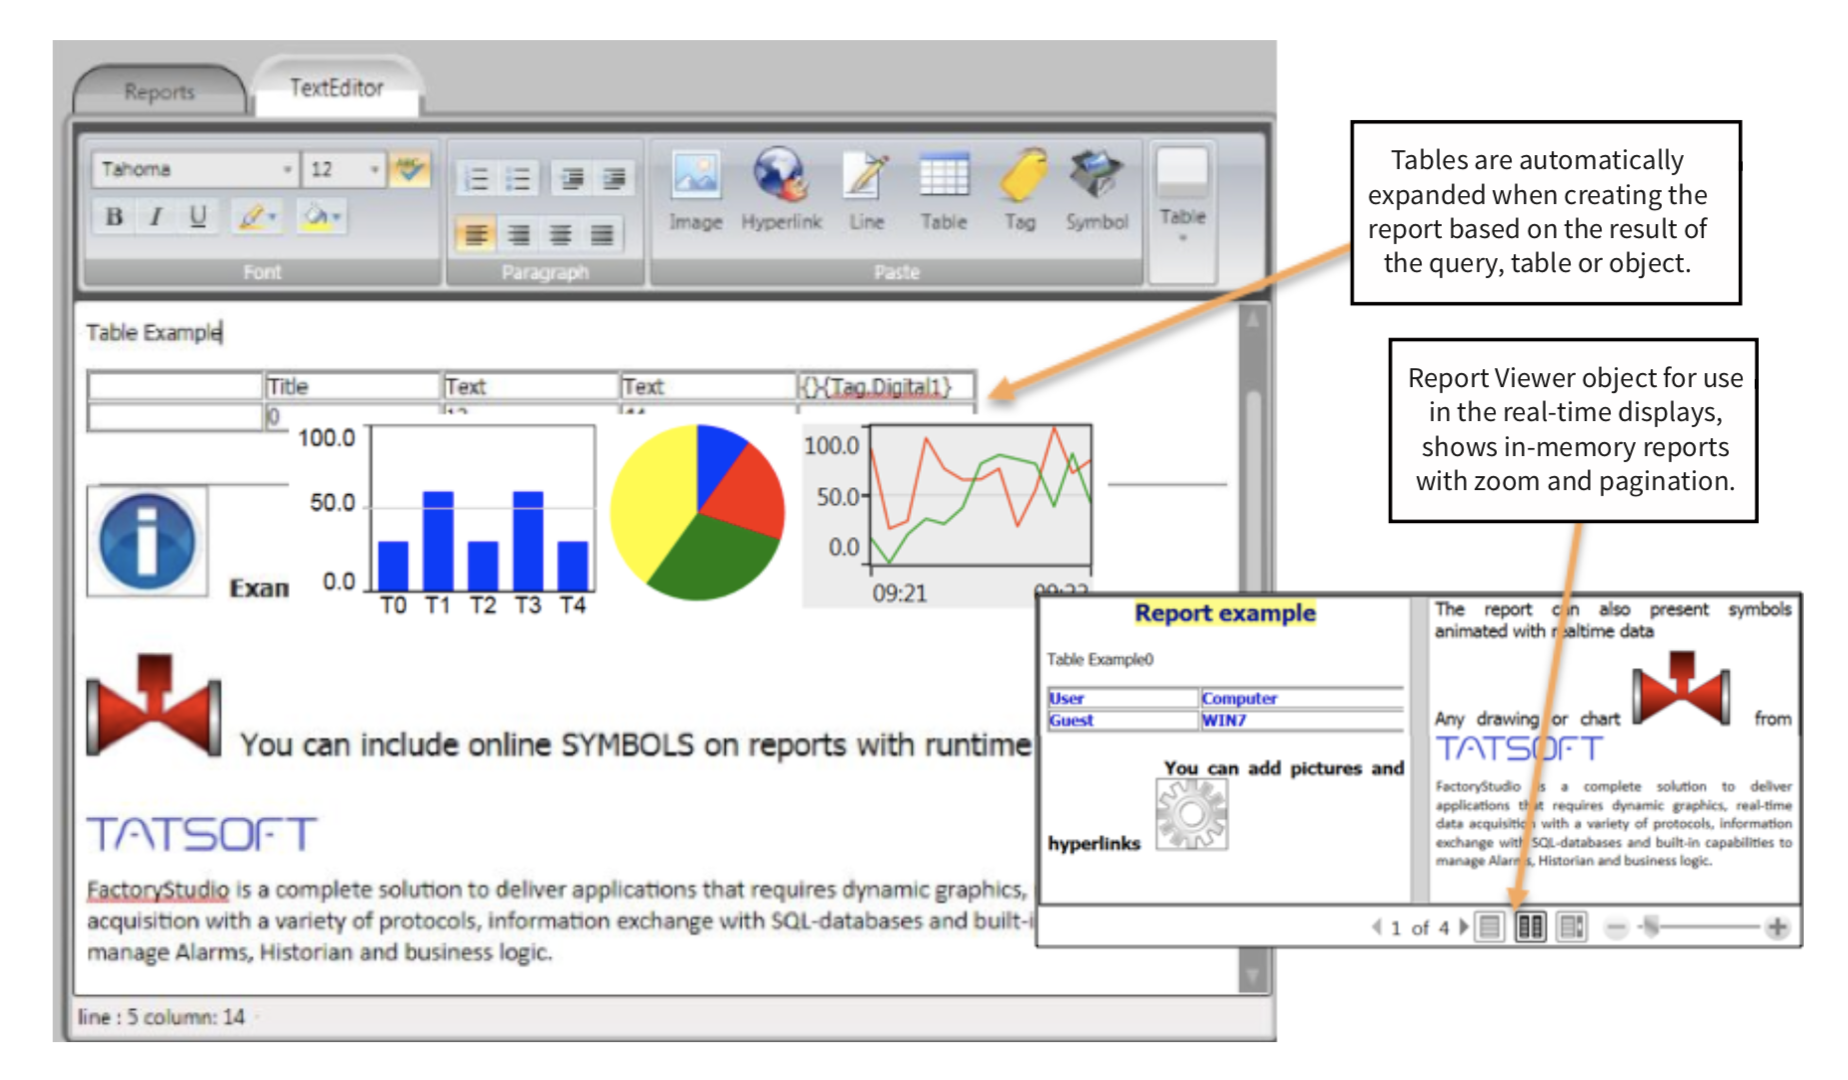
Reports can be saved in multiple formats: Text (ASCII or Unicode), HTML, XPS and PDF!
FactoryStudio includes a user-friendly simple Report layout editor integrated with the engineering workspace. The rich text format uses underlying XAML flow document technology from WPF, Windows Presentation Foundation; that enables the inclusion of graphics and flexible formatting.
The runtime displays can be opened in background or saved to image files, allowing you to create rich graphic snapshot reports. Current displays and layouts also can be printed or saved as an image to disk.
The report generator ability to append files, based on the project configuration and real- time tags, can be used to create CSV and text logging files for scenarios that require the information to be created as time goes by, such as batch reports and shift reports.
| Tip | ||
|---|---|---|
| ||
Reports can be saved in multiple formats: Text (ASCII or Unicode), HTML, XPS and PDF! |
Any symbol from the real-time displays can be included in the Report. The dynamic behavior of the symbol, such as color, text output, and rotation, are all updated using the current tag values when generating the report. User controls, like Trend and Bar charts can be added as well.
The contents of database tables and queries can be added to the reports. The queries and report generation execute in isolated processes, not interfering with the real-time processing.
A complete .NET Data Access library is available to create custom reporting solutions or to integrate with Microsoft Office, SQL server reporting services or other vendors tools. A COM model API is also available to be used from Excel VBA and JavaScript applications.